A polyvagal infographic turned into a zero-dependency interactive artifact, shipped to production in one session.
I took a NotebookLM-generated infographic on anxious overachievement and built an interactive data-exploration layer on top of it — 8 clickable hotspot zones, a full pan/zoom engine, glassy tooltip reveals, and a split-panel detail view — all in a single self-contained HTML file with no framework, no build pipeline, and no external JS. Deployed to Cloudflare Pages the same night it was built.
View live ↗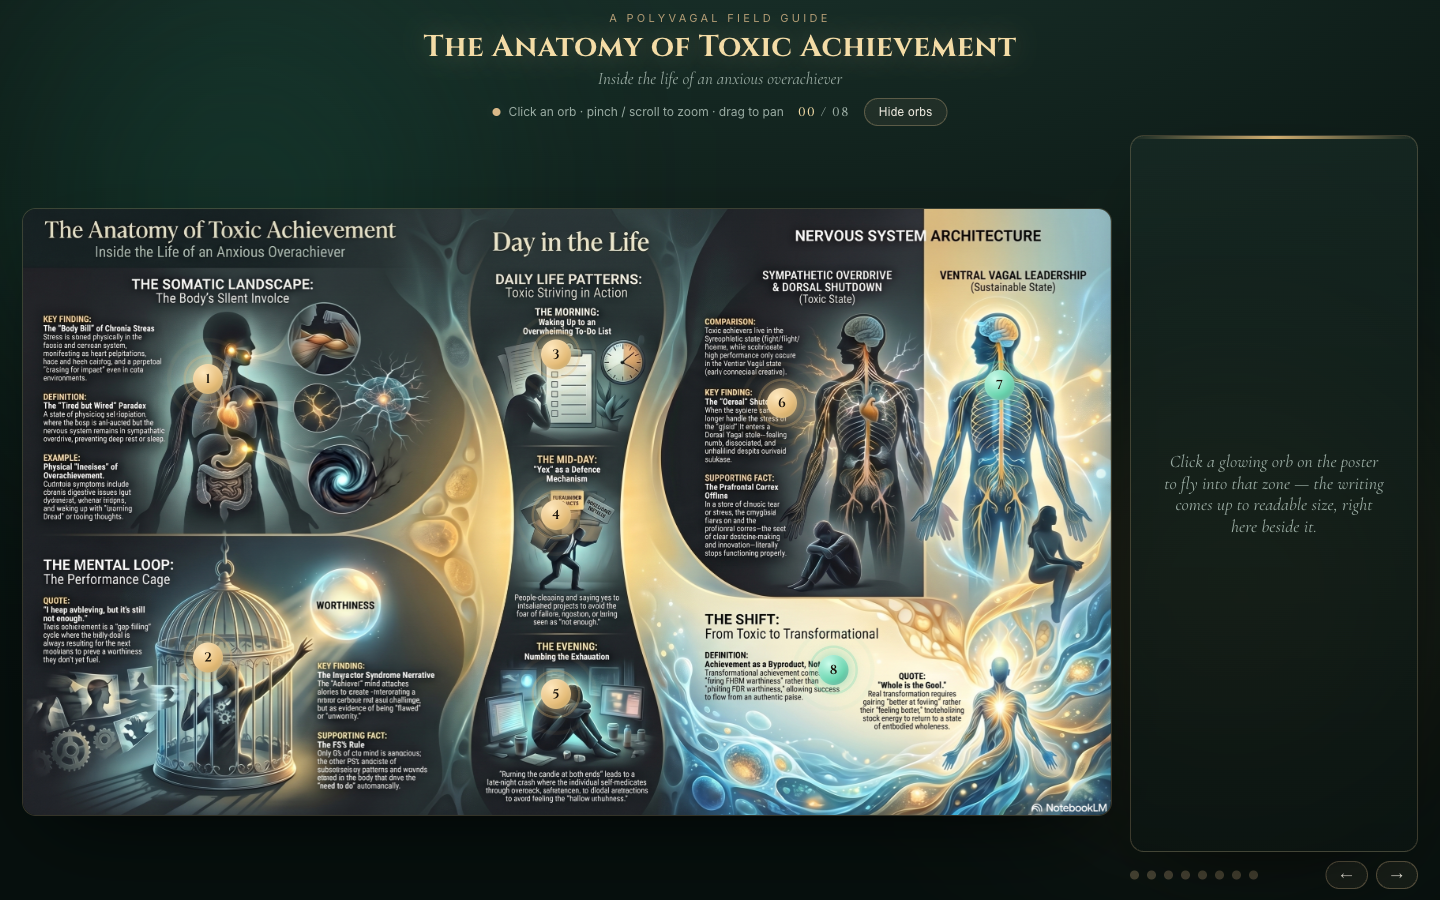
The brief
A NotebookLM infographic — “The Anatomy of Toxic Achievement” — explored polyvagal theory through the lens of anxious overachievement: body costs, the mental performance loop, a day-in-the-life arc, nervous system states (sympathetic overdrive vs. ventral vagal regulation), and the shift toward sustainable achievement. The static poster was dense and rewarding, but demanded a second pass to absorb. The goal was to make it interactive — something you could explore zone by zone, not scan in one glance.
What I built
A single-page interactive artifact where the infographic becomes the canvas:
8 hotspot zones sit precisely over the poster’s content regions. Each zone is a clickable orb — numbered, colour-coded by tone (warm amber for the “toxic” states, teal for the regulated states), with ripple-pulse animations and glassy tooltip previews on hover.
Click-to-reveal detail panel on the right: zone title, eyebrow label, lead sentence, structured findings (Key Finding / The Paradox / Supporting Fact), pull quotes, and a state badge (fight · flight · freeze vs. calm · connected · creative) for the nervous system zones.
Full pan/zoom engine built from scratch: pinch-to-zoom (trackpad ctrl+wheel), drag-to-pan with edge clamping, double-click punch-in to the selected orb’s coordinates, Esc/0/pill-reset to return to overview. A spotlight scrim dimly darkens the poster around your cursor when hovering in overview mode. A vignette activates in zoom mode.
Shareable build system: build_share.py embeds the poster as a base64 data URI, producing Toxic-Achievement-Interactive.html — a fully self-contained ~2 MB file that works offline, requires no server, and can be shared as a single email attachment.
How it’s built
Zero external JavaScript dependencies. No React, no build pipeline, no bundler. The entire interactive layer — state machine, zoom engine, panel renderer, animation sequencing — is ~390 lines of HTML/CSS/JS.
Visual identity runs on CSS custom properties: --gold, --teal, --paper, --muted + per-zone --m-hi / --m-mid / --m-lo / --m-glow for the orb gradients. Typography stacks Cinzel (serif display) + Cormorant Garamond (italic body) + Inter (UI) — all loaded from Google Fonts.
The zone data lives in a SPOTS array with percentage-based coordinates (x, y, w, h) so hotspot positions are intrinsically responsive to the poster’s aspect ratio (2752×1536, enforced via CSS aspect-ratio). Two tone profiles — warm and calm — drive the orb colour system without per-zone hardcoding.
The pan/zoom engine uses CSS transform: translate() scale() with will-change: transform and a custom cubic-bezier easing (0.45, 0.05, 0.2, 1) for the animated transitions. Edge clamping is computed from getBoundingClientRect() on every frame to prevent panning outside the image boundary at any zoom level.
Deployed to Cloudflare Pages (toxic-achievement.pages.dev) directly from the dist/ folder.
Why it matters
This piece demonstrates three things at once: narrative architecture (structuring polyvagal theory into a coherent 8-zone exploration path), interaction design (turning a static poster into a spatial document without overwhelming it), and no-framework engineering discipline (shipping a genuinely complex UI — animated, zoomable, state-driven — in a single file any non-technical person can open or forward).
The self-contained build artifact is the deliberate design decision: a shareable .html file that needs no cloud, no login, and no explanation. That constraint shaped every technical choice.
Want something like this?
That's the kind of thing I build. Tell me about yours.